How to troubleshoot recipe errors using network tracing

Why is network tracing important?
Network tracing plays an important role when troubleshooting recipe errors. When building integration and automation projects, troubleshooting is one of the hardest but unavoidable part of the process. These projects often involve multiple business systems and cloud applications (e.g. Salesforce, Workday etc).
The complexity of such projects may be a challenge when developers or analysts run into errors such as HTTP 404 Not Found, or perhaps a 422 Unprocessed Entity error like the one below.
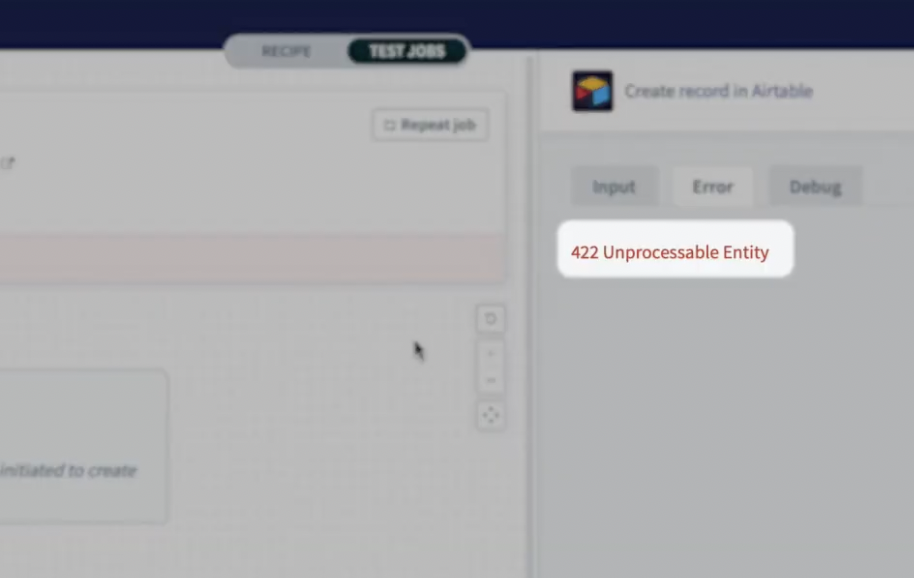
422 Unprocessed Entity Error
Without any further information on the error, it makes it difficult to debug and troubleshoot. However, network tracing makes it easy for users to see detailed HTTP requests and responses for each action line. This includes:
- HTTP URL to which the request was made
- HTTP request headers
- HTTP response headers
- HTTP request payload
- HTTP response
With these information at hand, it gives you full visibility into how your data is handled at every step, making it easier to identify the root cause of any errors.
How to use network tracing to troubleshoot recipe errors in Workato
Step 1: Enable network tracing
To enable network tracing, in the left menu bar of your screen, go to Workspace Admin > Settings > Debug > Enable Network Trace

Enable network tracing in account settings
Note that by default, network tracing privilege is only available to users with admin role or users who are owner of the Workato account. You may assign network tracing privilege by creating a custom role.
Also read: How to use Role-Based Access Control for collaboration governance in Workato
Step 2: Build your recipe
For the purpose of this demonstration, we are looking at this recipe below that:
- looks out for any new or updated closed won Salesforce opportunities
- creates or updates a record in Airtable where we track our deals.
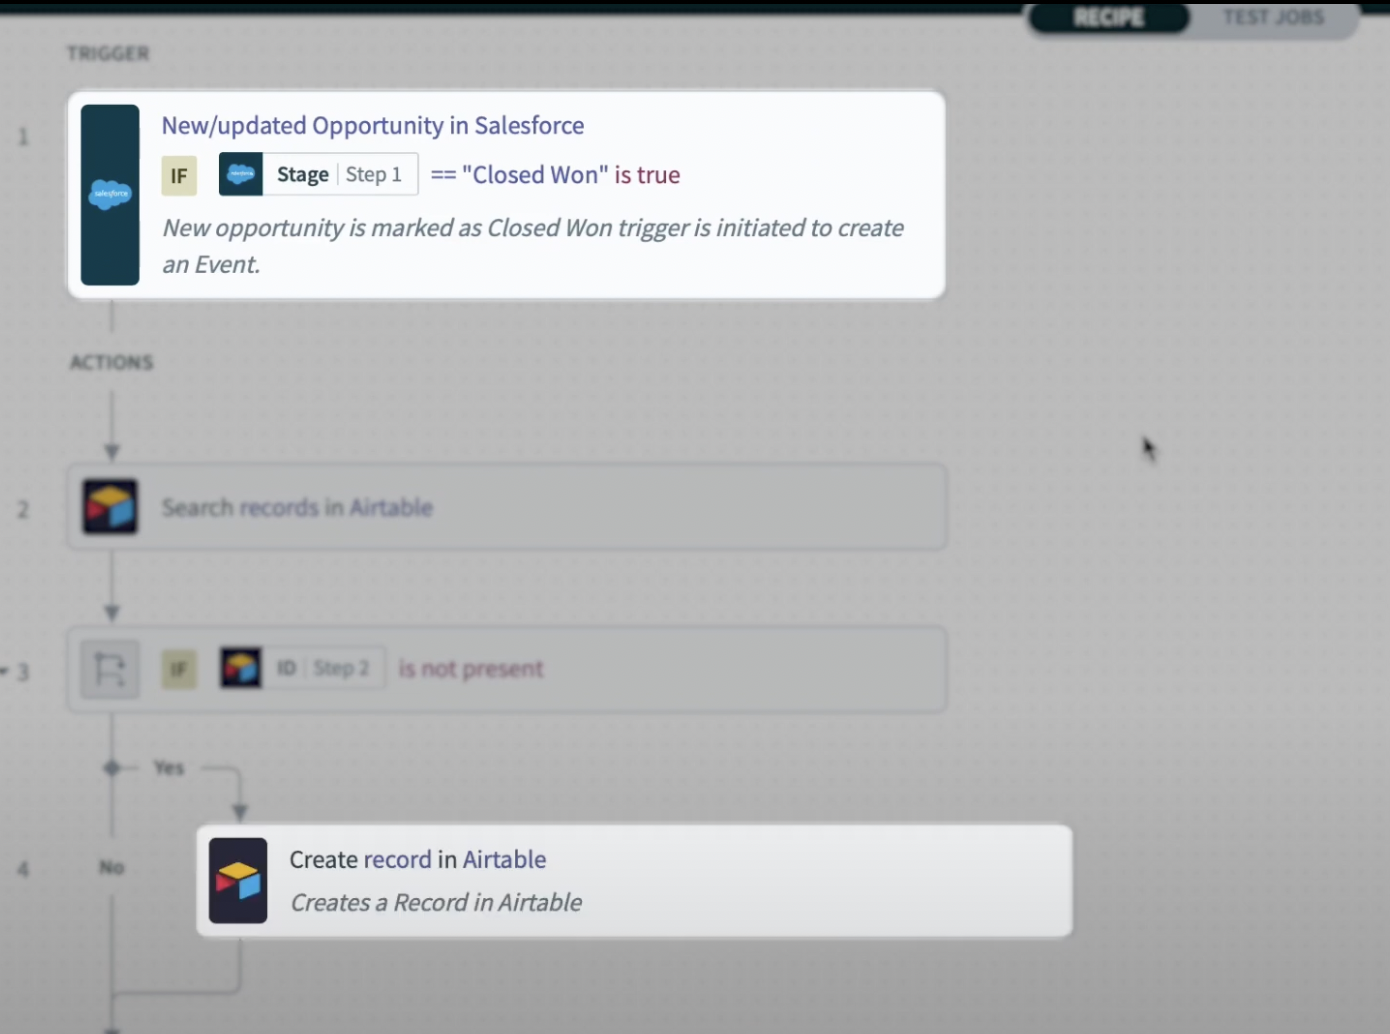
Salesforce and Airtable integration recipe
Step 3: Run a test job
After setting up your recipe, run a test job to identify any potential errors. In this case, the job report from the test job shows that the recipe failed at step 4 and it returns a 422 error message. At this stage, just the error message alone does not provide us enough information to troubleshoot the problem.
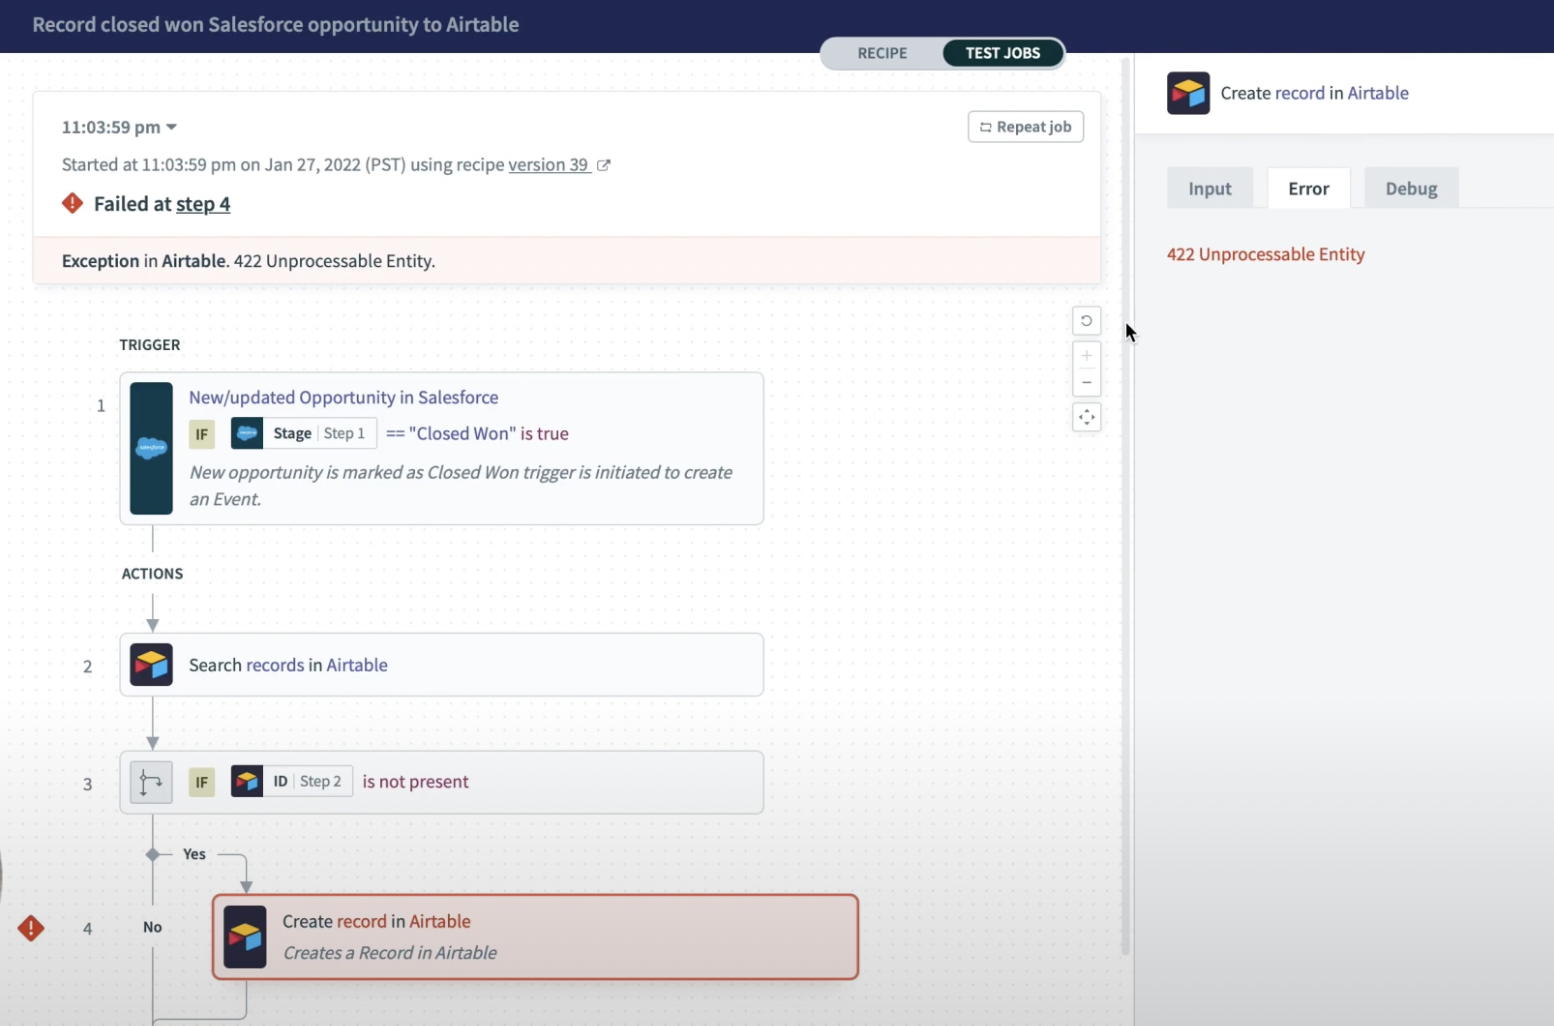
Recipe error at step 4 with 422 error message
Step 4: Network tracing
To obtain more information about the error, click debug for this step. In this tab, you can view the network request as well as the HTTP codes, headers, payloads, and the response from the API calls made to Airtable when the action was executed.
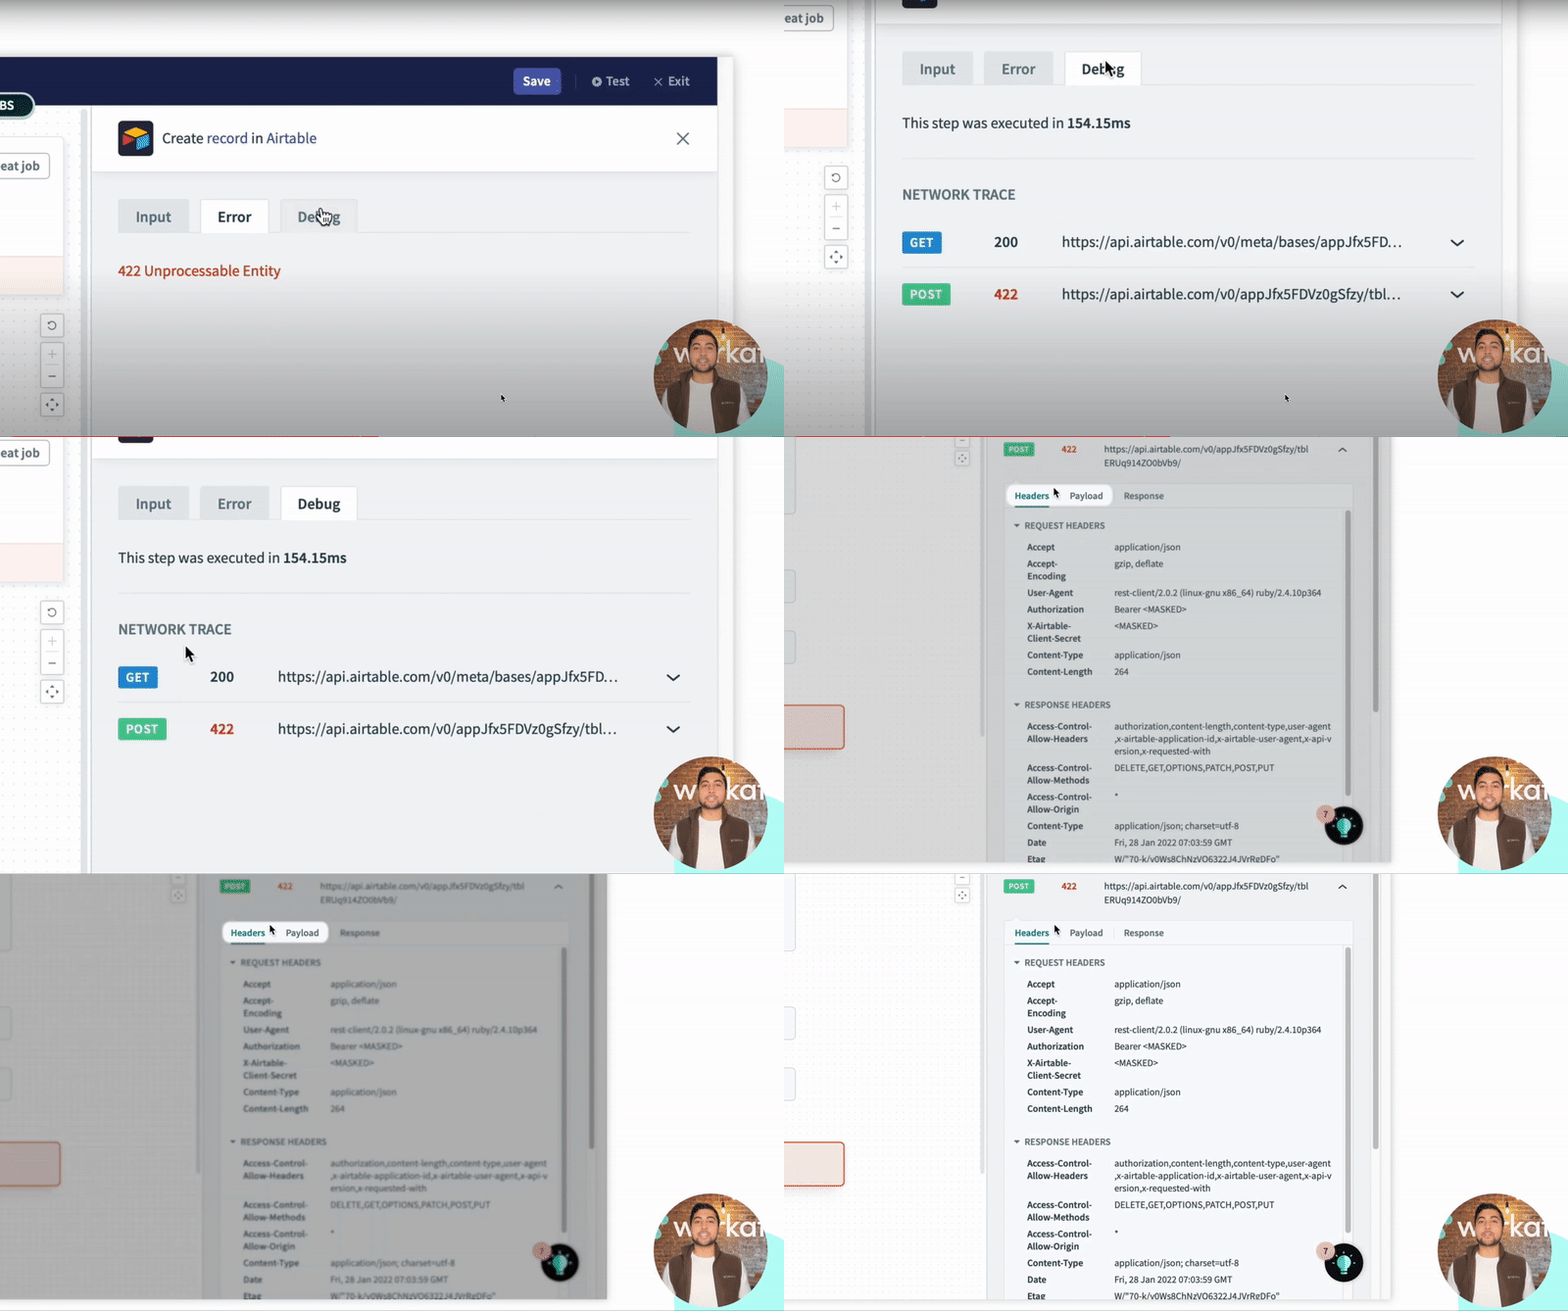
Network tracing in the Debug tab
In this case, by navigating to the response tab, we can see that the probability field cant accept the provided value — which led to this job failing.
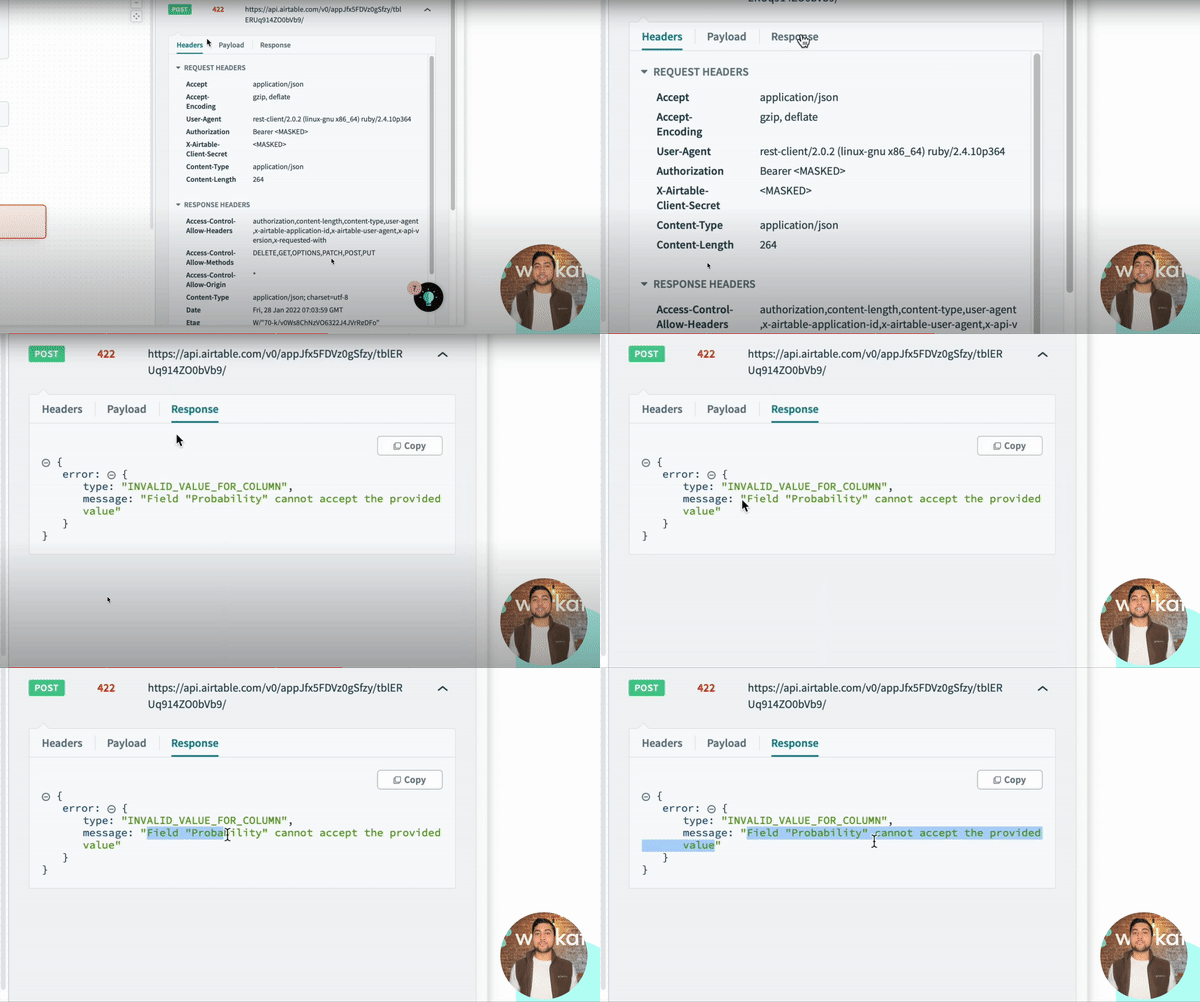
Error message: ‘Probability field’ cannot accept the provided value
Step 5: Troubleshoot the error
With the error information we obtained in steps 3 and 4, we know that:
- The error occurred at step 4 of the recipe
- The
Probability Fieldin step 4 cannot accept the provided value
Going back to step 4 of the recipe editor, we can see that there is a date/time data pill in the probability input field — which caused the error.
To rectify the error, we can swap out the date/time data pill to a probability data pill, and save the recipe.
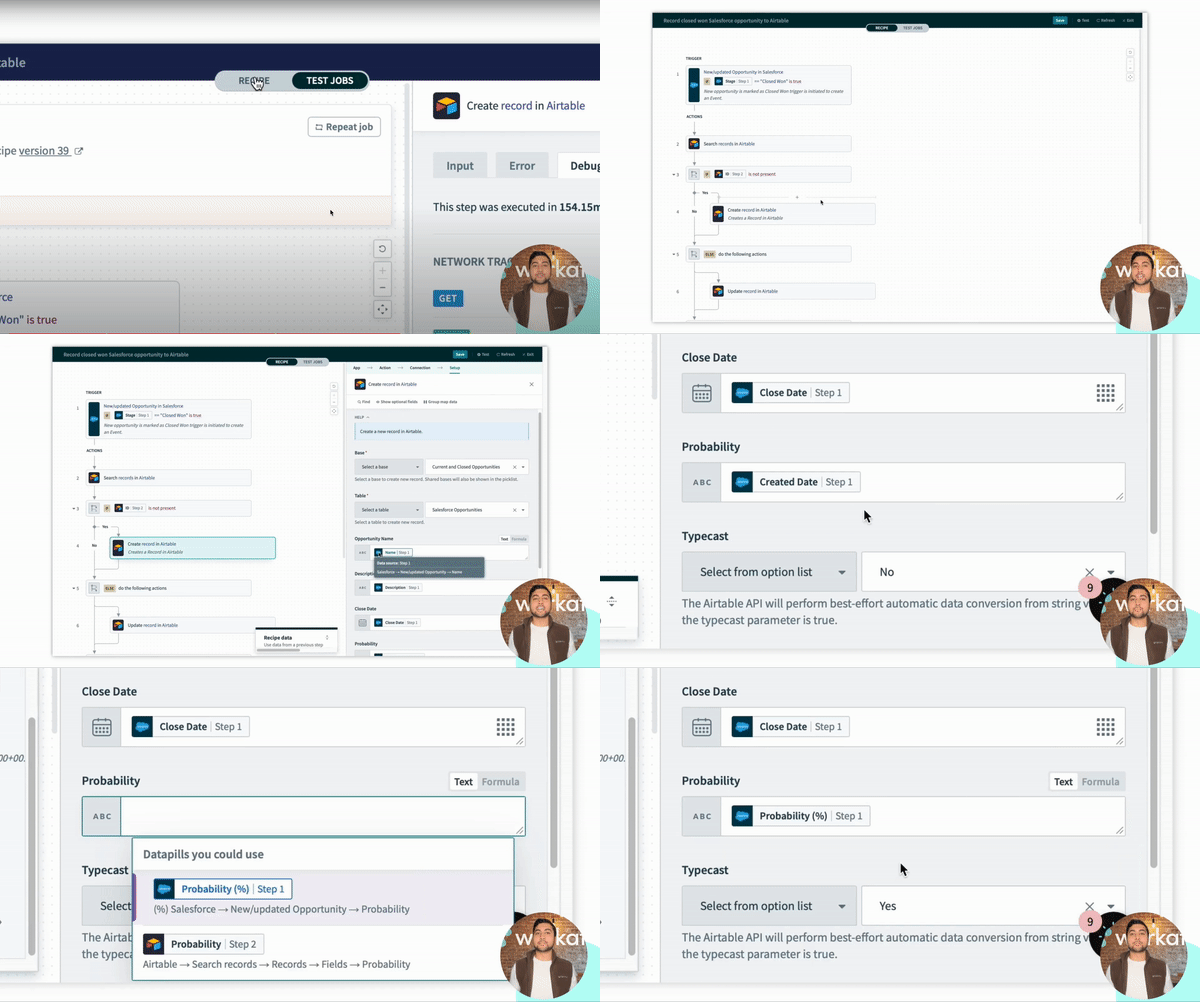
Rectifying the Probability field by swapping out the Date/time data pill
Step 6: Test your recipe again
Since the recipe caches each trigger event, we can test our fix directly from the first job report without having to manually reproduce the trigger.
Click Repeat job to test our updated recipe.
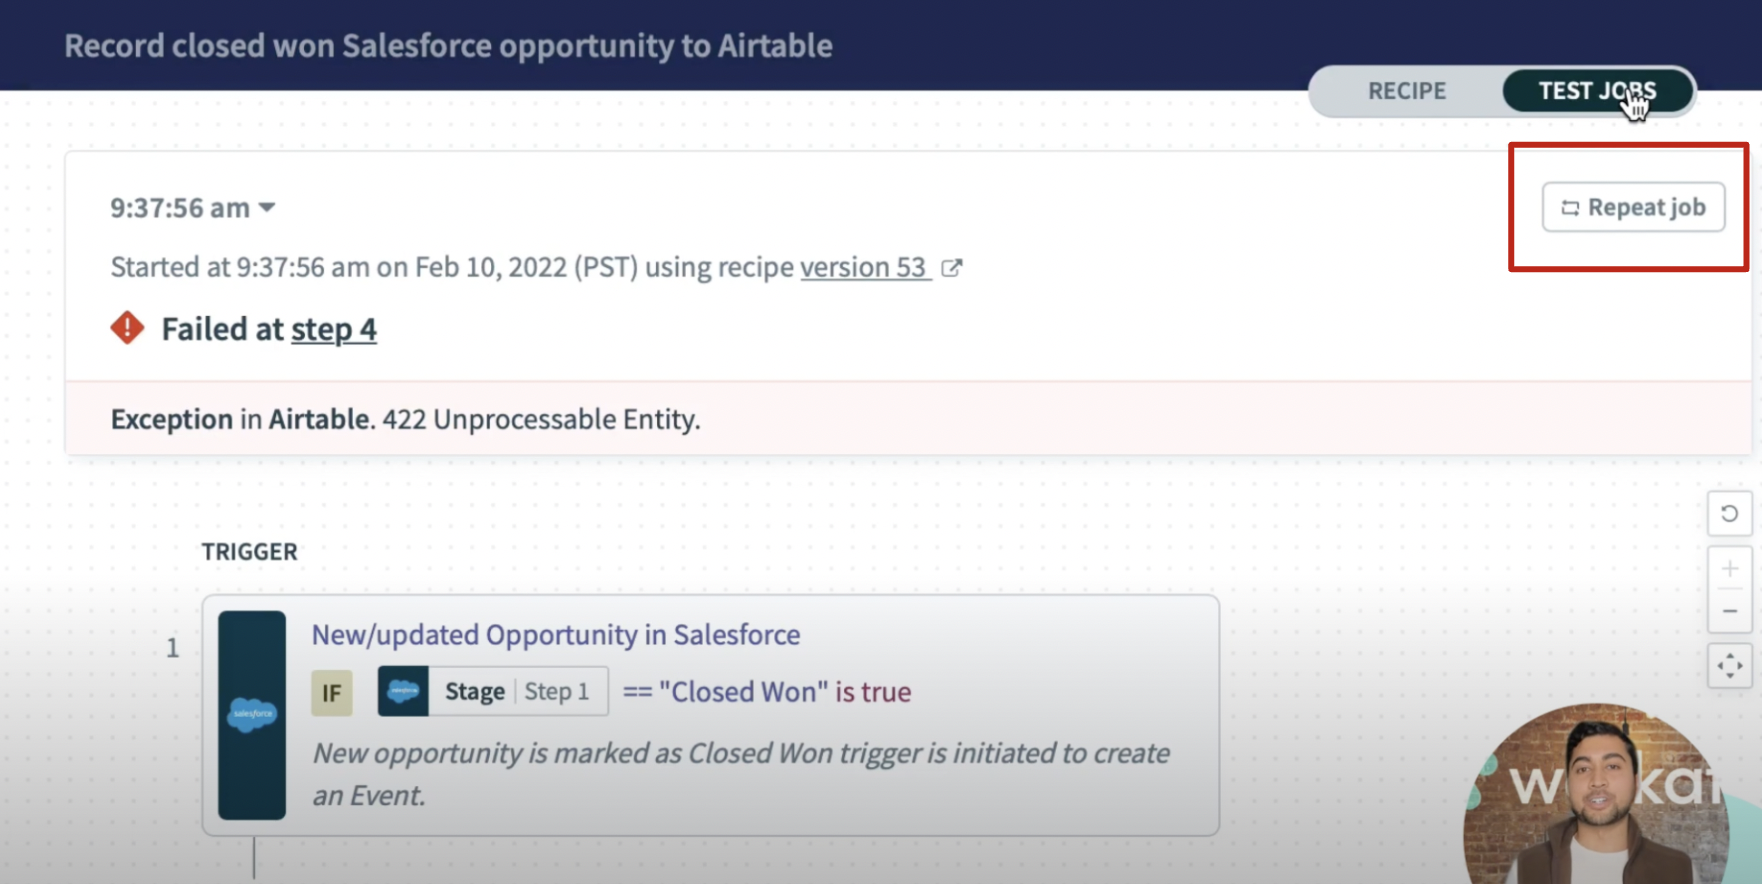
Repeat job to test the updated recipe
You should see that the repeated job comes back as successful.
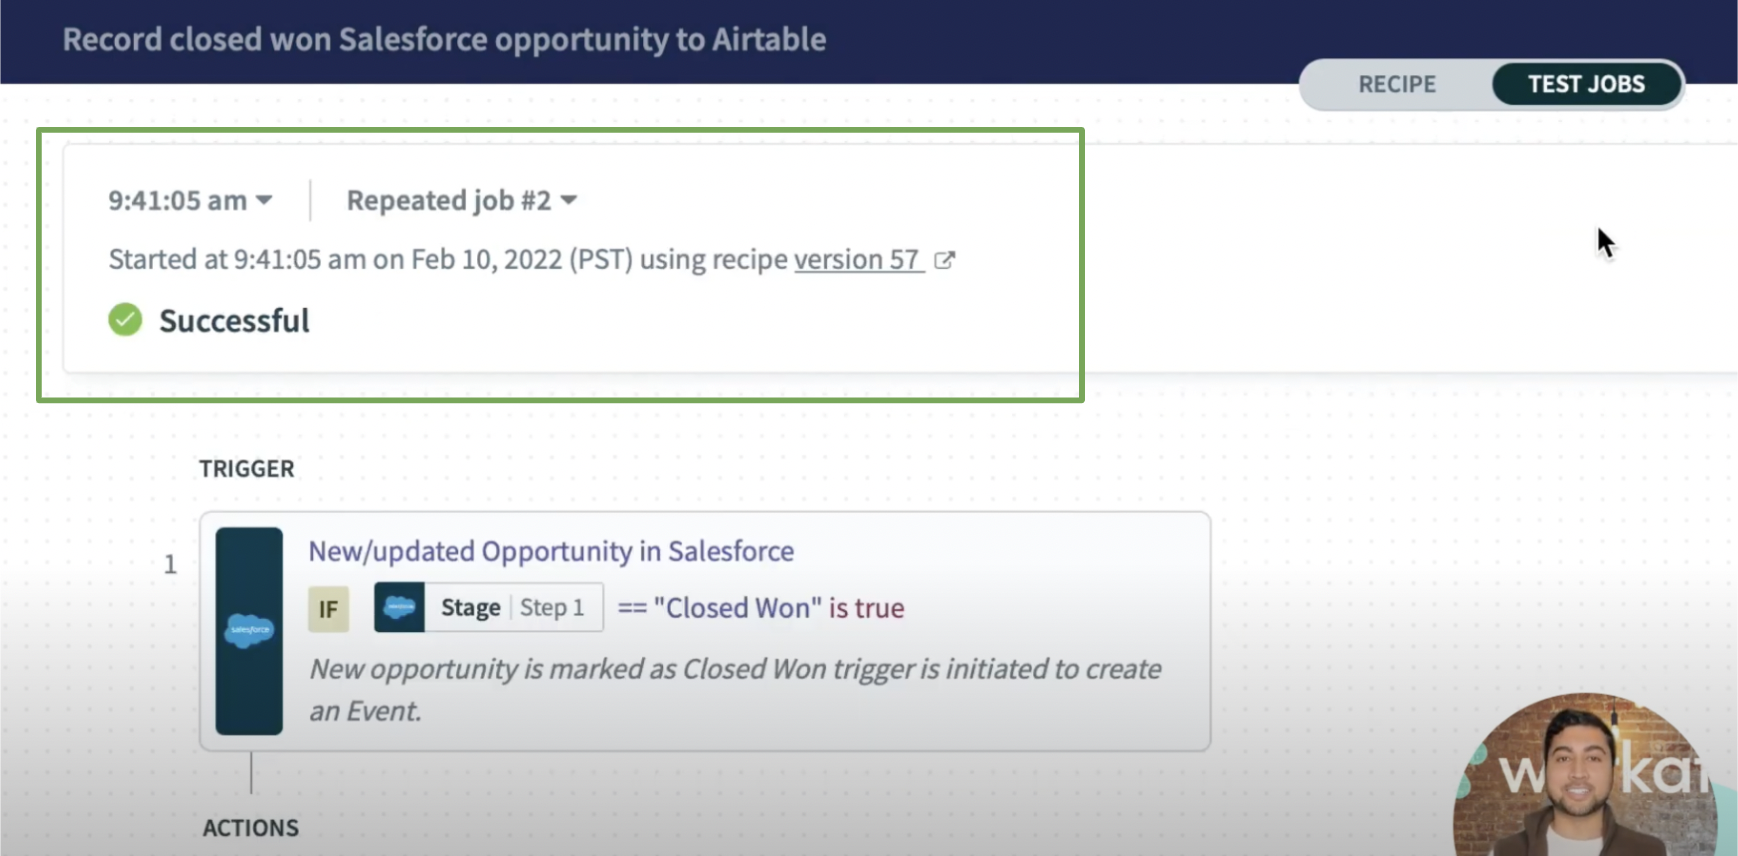
Successful test job
Learn more about network tracing
To learn more about network tracing, read the full documentation on network tracing here.
Also, to ensure the health of your recipes, learn about the best practices for recipe error handling and operations here.