
The Workato Way
Workato is the best in-class enterprise orchestration platform. We want to emphasize the platform word here, as everything we do is a platform: be it for iPaaS, data orchestration, API management, low-code applications, or chatbots. This approach makes the automation and integration possibilities endless, and our high standards of technology make all of these platforms truly enterprise-ready, scalable, and secure. The other key tenet of Workato is that our products are incredibly easy to use – the true low-code and no-code philosophy in action.
For years, we have been hearing from our customers that they want visibility into Workato data, how they use the platform, and even more importantly, how Workato contributes to their business. Workato is a pipe that business critical data flows through; in some cases, the relevant data is stored within Workato itself.
How do you slice and dice the data that has so many forms, and is part of so many different processes? It’s impossible to measure what matters to you with canned, non-customizable dashboards. That’s why we have created Workato Insights, our lightweight analytics platform to report on your Workato-based data.
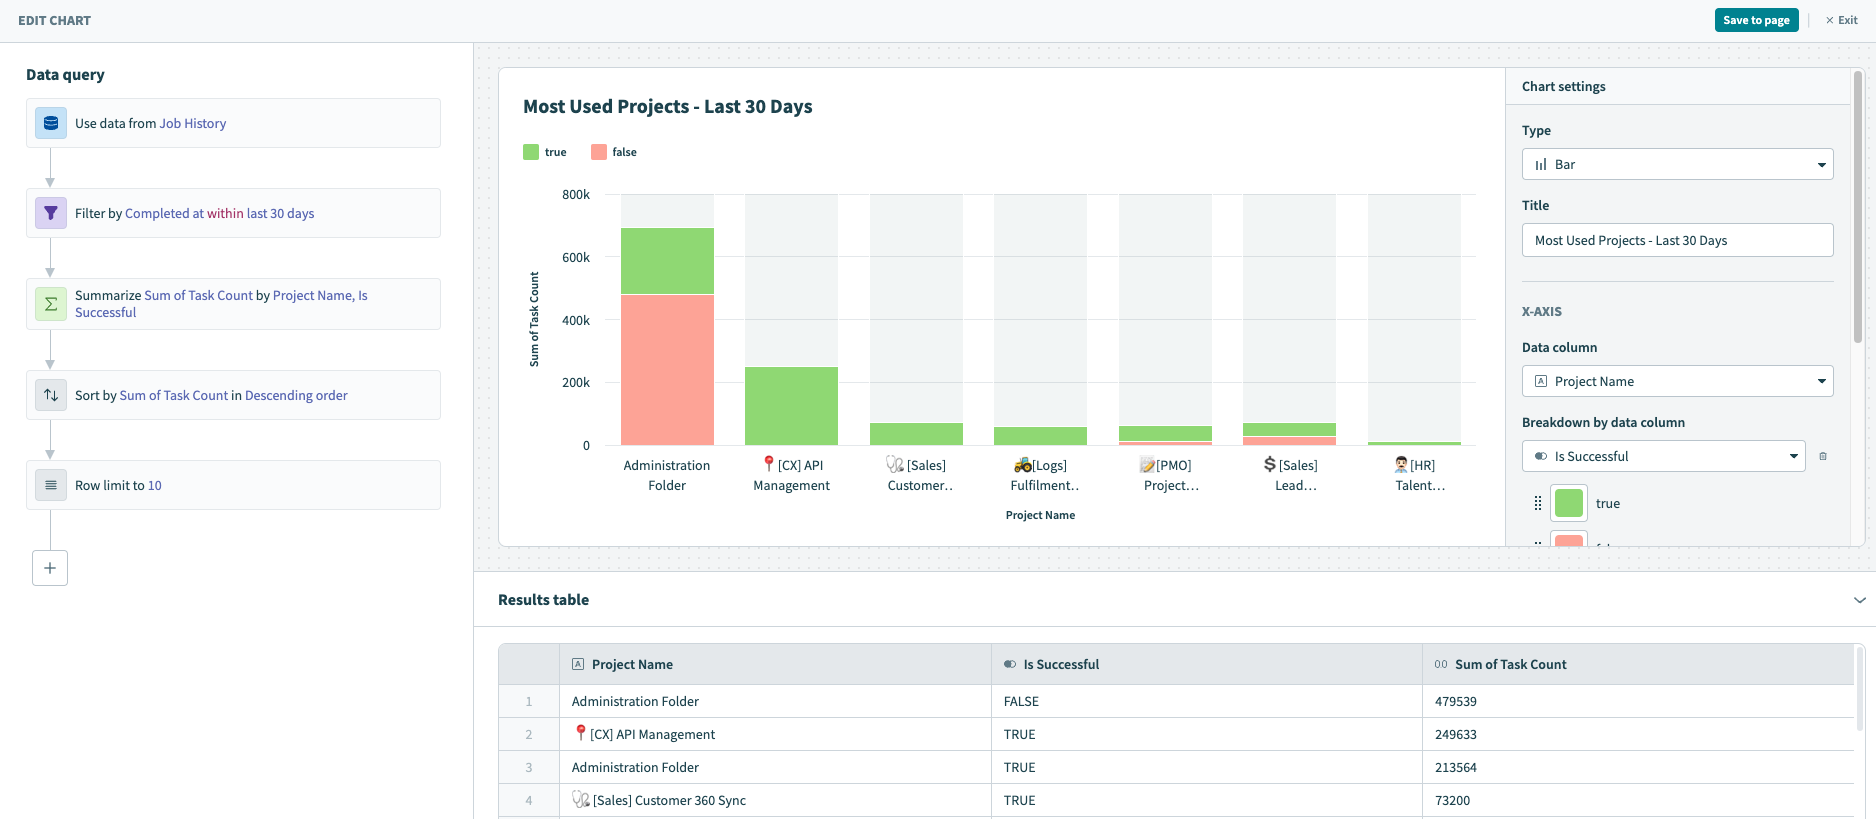
Insights is designed to be highly flexible and more intuitive than classic BI tools. At its core is a no-code widget designer that allows access to Workato-based data sources, like recipe job history, data tables, or Workflow App requests; this data can be transformed by building powerful data queries with zero code, then visualized effortlessly. Place your visualizations on a dashboard with a drag and drop editor, then share within Workato’s UI, or via the Workflow apps portal.
With Insights, the possibilities of what to measure and track are endless, but we have four ideas to get you started.
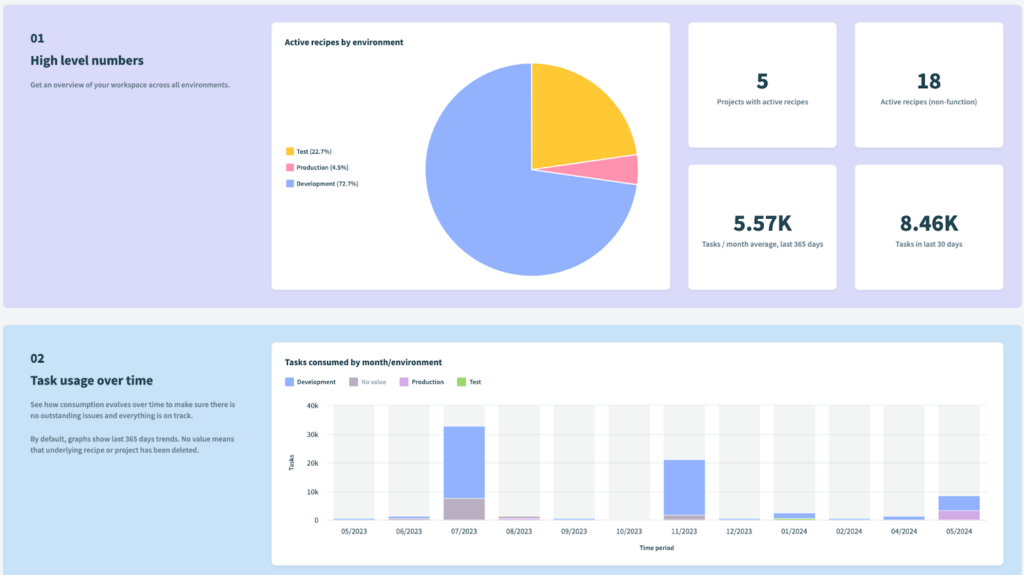
Workspace usage reporting
Have you ever wanted to dive deep into your workspace usage? With Insights, you can design your own usage analytics based on what matters to you and your administration team.
Common metrics we see:
- Count of active recipes
- Task consumption over time
- Errors by recipe this week
Getting started with usage reporting is as easy as 3 clicks: Create a new dashboard, select the Workspace overview template, and hit Create dashboard!
❓ How is this different from the built-in admin dashboard? One word: customization! You can recreate the metrics found in the standard Dashboard with Insights, but also customize and filter to what you care about most. Care more about task consumption by environment? Want to slice and dice by recipe type? We’ve got you covered!
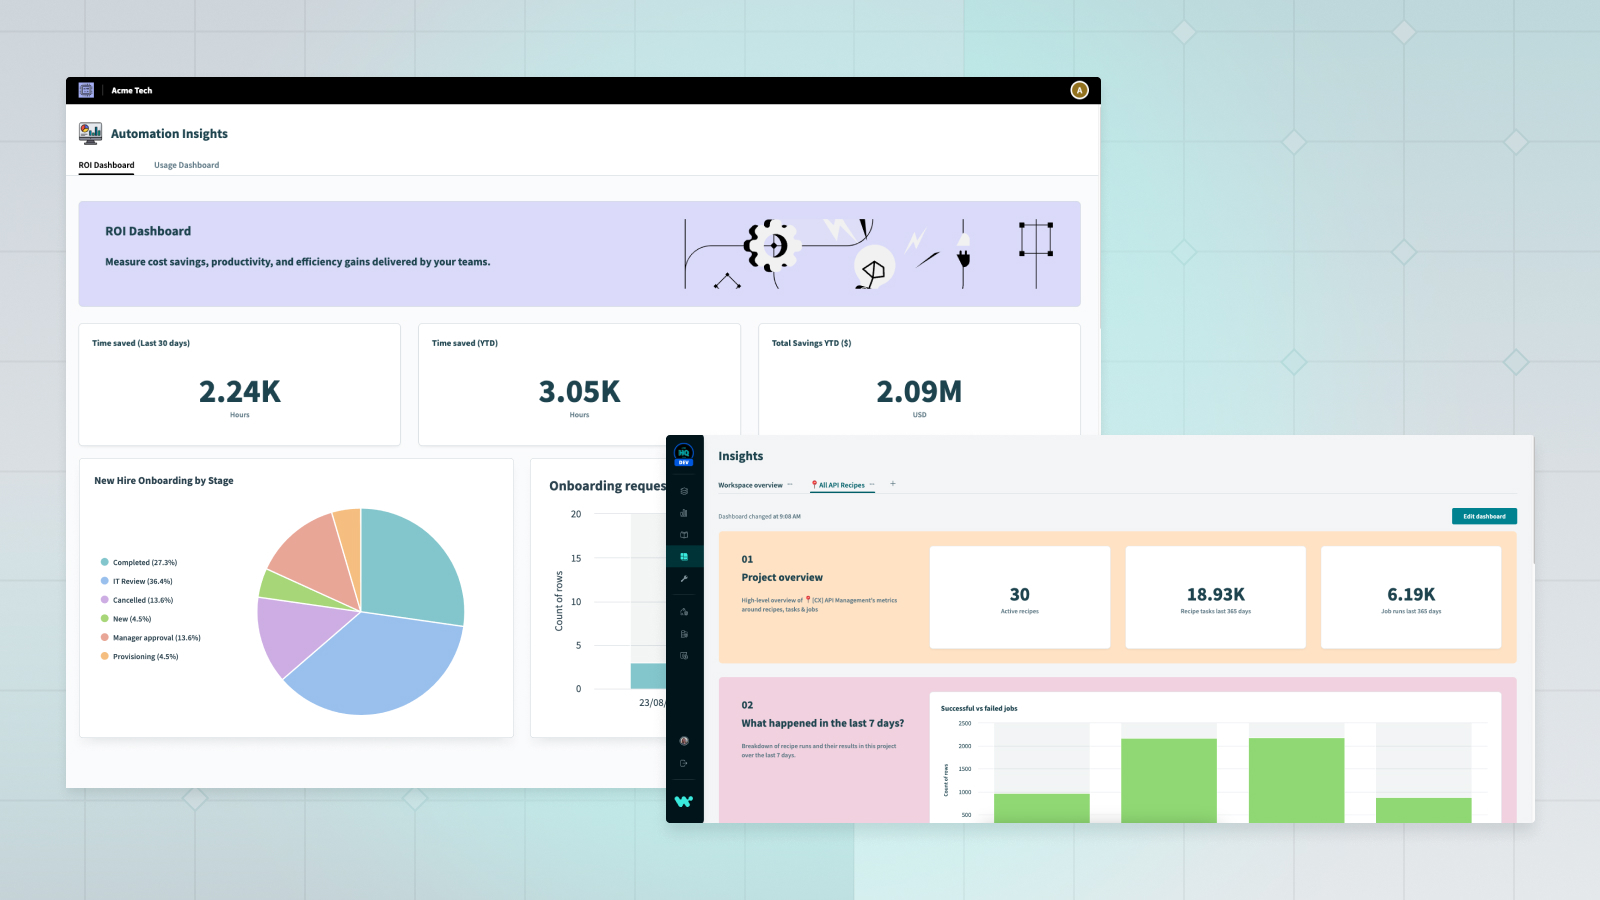
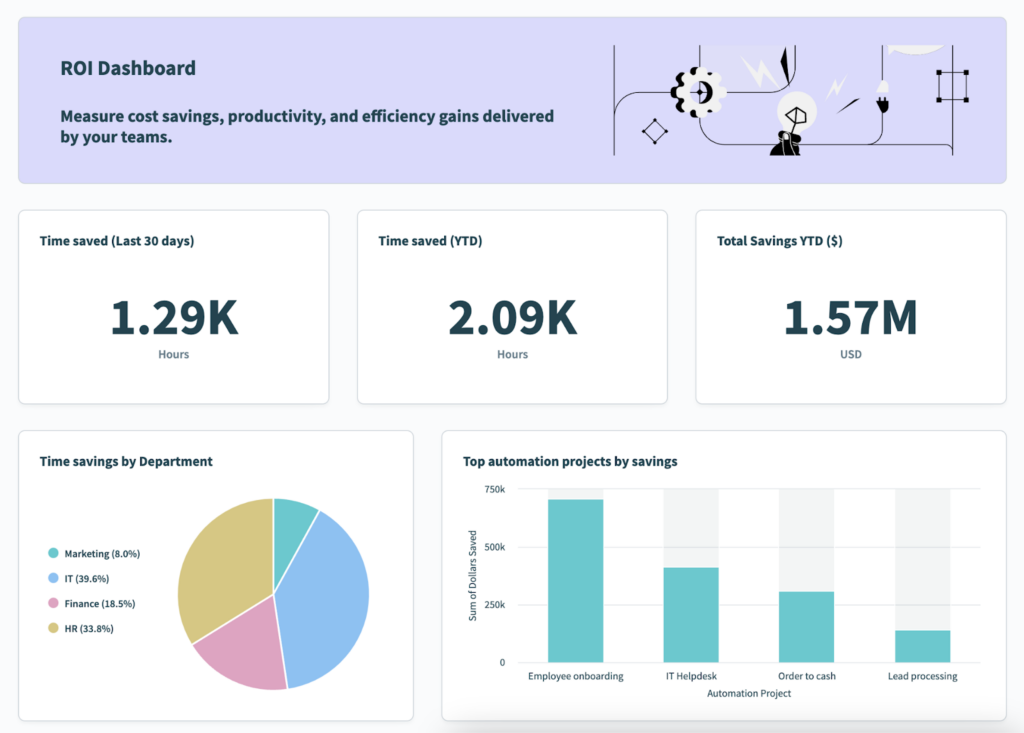
Automation impact and ROI
Quantifying impact and ROI is like magic – doing it with real-time data feels like a superpower!
Common metrics we see:
- Total amount saved ($)
- Hour saved last month by a specific process
- Savings by process or department
Automation ROI calculations are easily configurable to your workflows and processes. By setting up a data table tying recipes to dollars or time saved, then joining with your job history, you get real-time data about the ROI of your automations. Roll all of those numbers up, and see how much time automation is saving you every day!
Process analytics
Process analytics are the most customized kind of analytics; your recipes and automations are tailored to serve your business needs and applications. With Insights, you can customize the data and metrics to derive the critical insights.
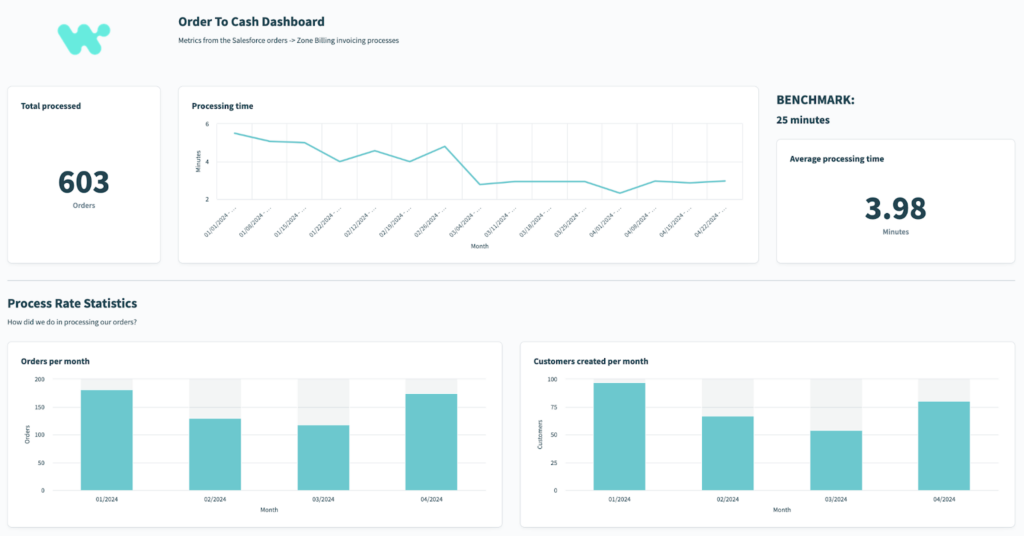
Common metrics we see:
- Orders processed last month
- Orders by region
- Average order processing time
By either adding custom columns to your job history or pushing key data points to a data table, the data can be aggregated and analyzed to fuel your decision making.
Workflow App analytics
Layering the Workflow App experience on top of your human-in-the-loop processes creates a one-stop shop for your teams to manage their work and approvals. But how do you measure the effectiveness, throughput, and completion rates of these human-led workflows?
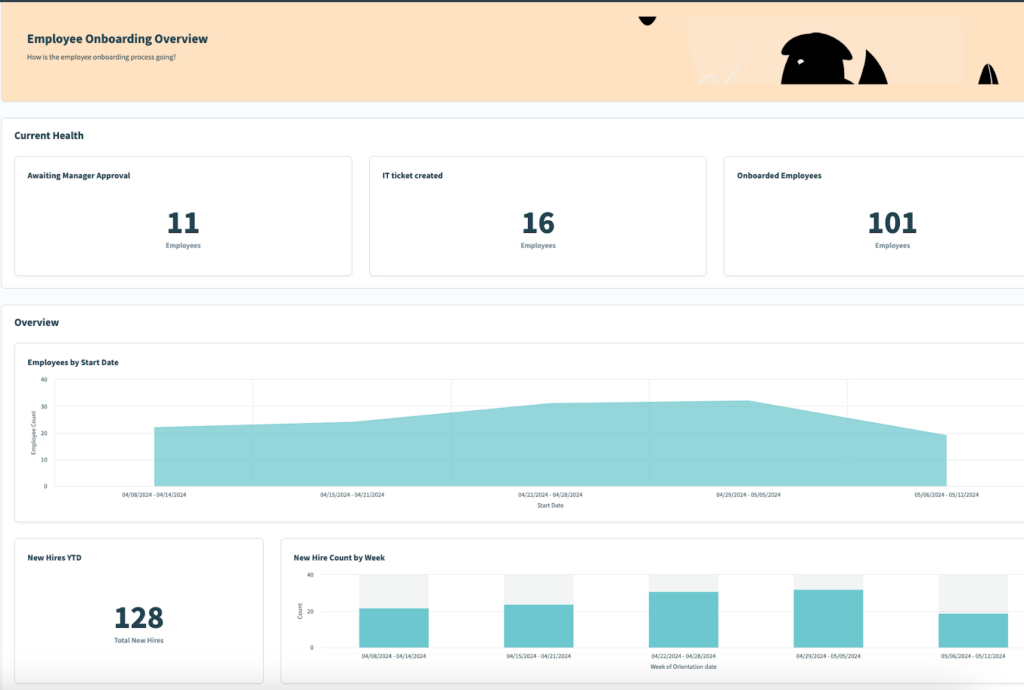
Common metrics we see:
- Total requests processed last month
- Breakdown of requests by region
- Average processing time
Each Workflow App’s table serves as a data source, making it easy and intuitive to query. As with process analytics above, custom columns can be added to recipes to capture specific metrics you desire.
Get started with Insights today
Insights is available for the Business and Enterprise platform plans, or workspaces with the Advanced Resources Management add on. If it is not included in your plan, or you would like to discuss how Insights can take your automation impact to the next level, reach out to your Customer Success representative.